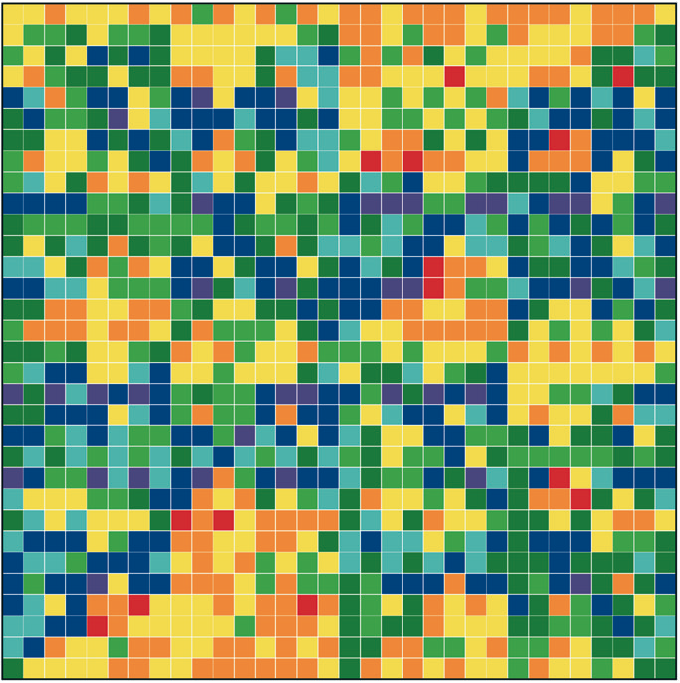
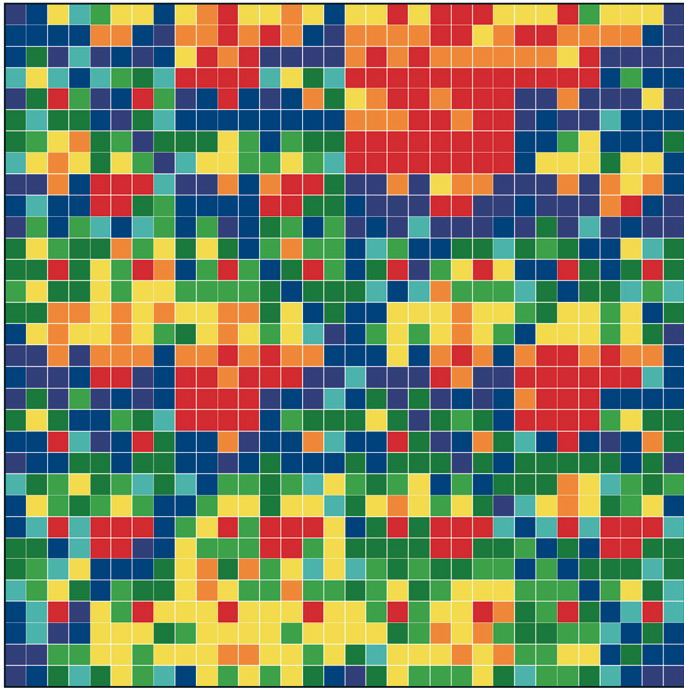
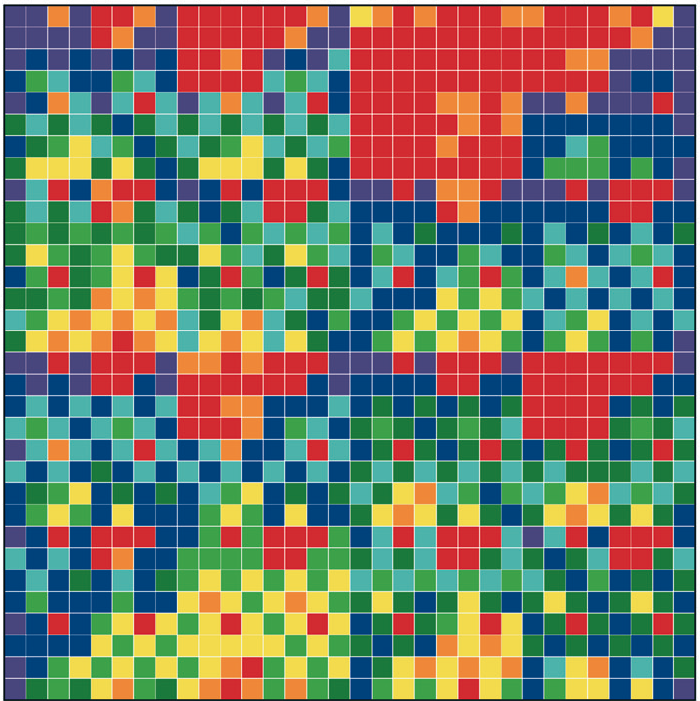
Figure 1: “Genomic portraits” of (a) coding, (b) non-coding (intronic), (c) model generated sequences. Colored squares correspond to frequencies of occurrence of 5-tuplets; warm vs. cold colors indicate under- vs. over- representation. In (d) the successive steps of our proposed evolutionary model [8] are monitored through rank distribution curves. Sequence F corresponds to the genomic portrait shown in (c).
Examining a genomic sequence by means of several approaches, we showed that the distribution of n-tuplet frequencies correlates with the functionality of the sequence, either if the study is done in a reading-frame specific way or not. In [5] we developed one such approach, which is able to reveal aspects of n-tuplet usage that are related to distinct functionalities. It is based on a simple summation of n-tuplet frequencies after filtering the background nucleotide composition. Simple measures of n-tuplet occurrence were introduced in the genome study, after suitable modifications of standard visualization tools (“genomic portraits” and “rank diagrams” of n-tuplet occurrence) [8]. A simple model may generate such patterns [2] as shown by means of various measures of nucleotide composition [2, 4]. Moreover, when examining triplets by several reading-frame specific modes, significant distinction of coding and non-coding sequences can be achieved, leading to the conclusion that the n-tuplet usage may be indicative of the sequence’s coding potential [5, 6, 8].
Chargaff’s 2nd parity rule and its implication for microbial and organellar evolution are studied
(a) (b)
(c) (d)
Figure 2: Examples of nucleotide and CDS skews. (a) A typical eubacterium, E.coli, with clear-cut GC and CDS skew. (b) Nostoc sp., a nontypical eubacterium, exhibiting fluctuating skews. In (c) a rearrangement of the coding segments in Nostoc sp. according to their transcription direction transforms the fluctuating AT skew into an almost perfect one [9]. In (d) we show that a simulation of genomic evolution in an artificial genome with several origins of replication generates a fluctuating skew.
The Chargaff’s 2nd parity rule in bacterial genomes has been studied. The impact of transcription and replication on the observed deviations from this rule has been determined. Two types of skew pattern, related to these deviations, are met in prokaryotes: the one is of a simple form helping the determination of the replication origin, while the other is a rather fuzzy one, without apparent correlation to any functional localization. They are typical for eubacteria and archaea respectively, but not without some notable exceptions (e.g. Nostoc sp). We have formulated the hypothesis that these patterns are related to two distinct modes of replication in bacterial species, the one characterized by a unique origin of replication and the other by multiple origins. Computer simulations of bacterial evolution corroborate the above hypothesis [9].
The structure of organellar genomes regarding the second parity rule was also studied in detail. We tested all available organellar genomes and found that a large number of mitochondrial genomes significantly deviate from the2nd parity rule in contrast to the eubacterial ones, although mitochondria are believed to have evolved from proteobacteria. On the other hand, chloroplast genomes share the pattern of eubacterial genomes and, interestingly, so do mitochondrial genomes of plants and of some fungi. The behaviour of the large majority of mitochondrial genomes can be attributed to their distinct mode of replication, which is fundamentally different from the one of the eubacteria. Results may provide some insight into different modes of evolution of genome structure differentiating between chloroplasts and mitochondria [12].
The chromosomal distribution of transposable elements (repeats) reveal a complex genomic dynamics expressed in the form if power-laws
(a) (b)
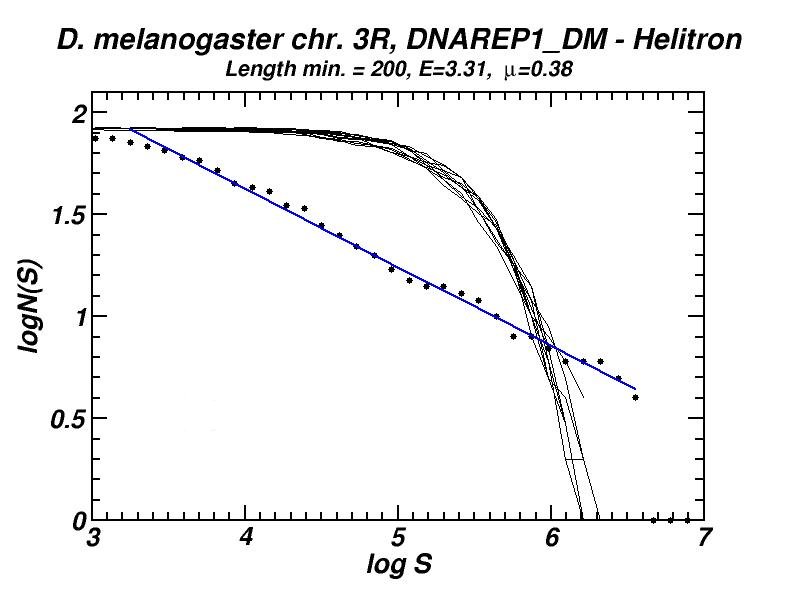
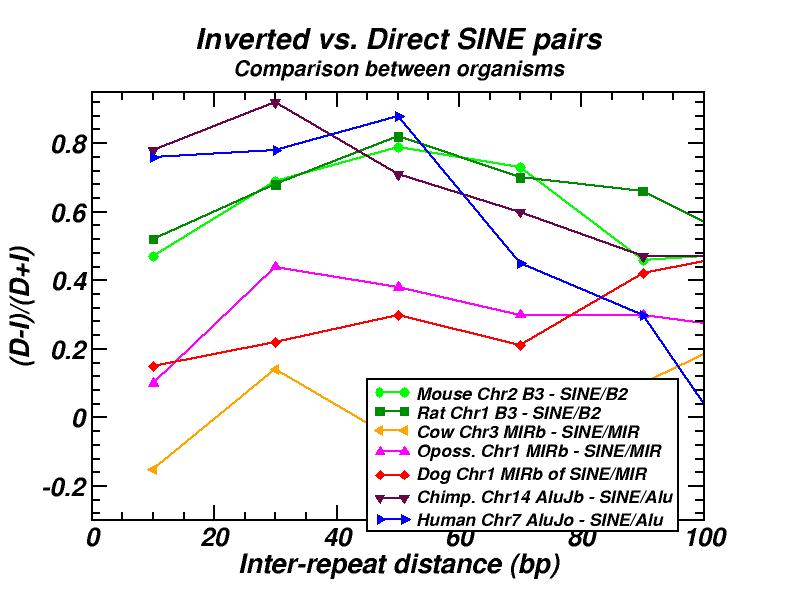
Figure 3: (a) Example of a power-law-like chromosomal distribution of distances between transposable elements. (b) The extent (E) of the power-law (high in Mouse, Rat, Homo, Chimp.; low in the other presented genomes) is in accordance with the frequency of inversed repeat eliminations as predicted by our model (for details see [13, 16]).
The spatial distribution and clustering of Transposable Elements (TEs), or repeats, is extensively studied during last years, as well as their co-localization with other genomic components. In a first work, we had investigated the large-scale features of the spatial arrangement of Alu and LINE1 in the human genome, by studying the size distribution of inter-repeat distances [13]. This study was extended later, including 14 genomes and repeats from all principal TE classes [16]. In most cases, we found power law size distributions extending in several orders of magnitude. We also studied the correlations of the extent of the power-law (linear region in double logarithmic scale) and of the corresponding exponent (slope) with other genomic properties. A model was formulated to explain the formation of the observed power laws. According to this model, two types of events occur repetitively in evolutionary time: random insertion of several kinds of intruding sequences and occasional loss of repeats belonging to the initial population due to “elimination” events. This simple mechanism is shown to reproduce the observed power law size distributions and is compatible with our present knowledge on the dynamics of repeat proliferation within genomes.
Large-scale order and long-range correlations found in the chromosomal distribution of genes, expressed in the form of power-laws and of a particular pattern of entropic scaling indicating fractality
(a) (b)

(c) (d)
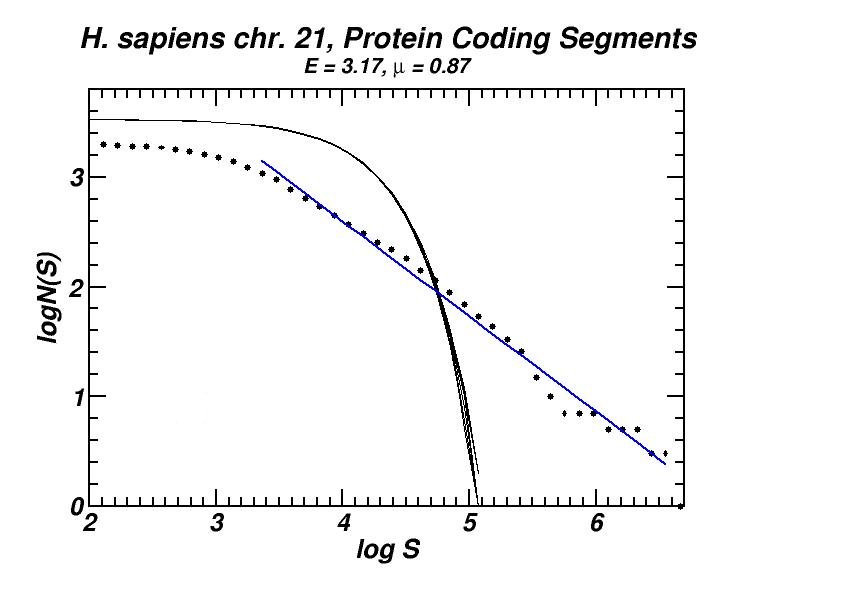
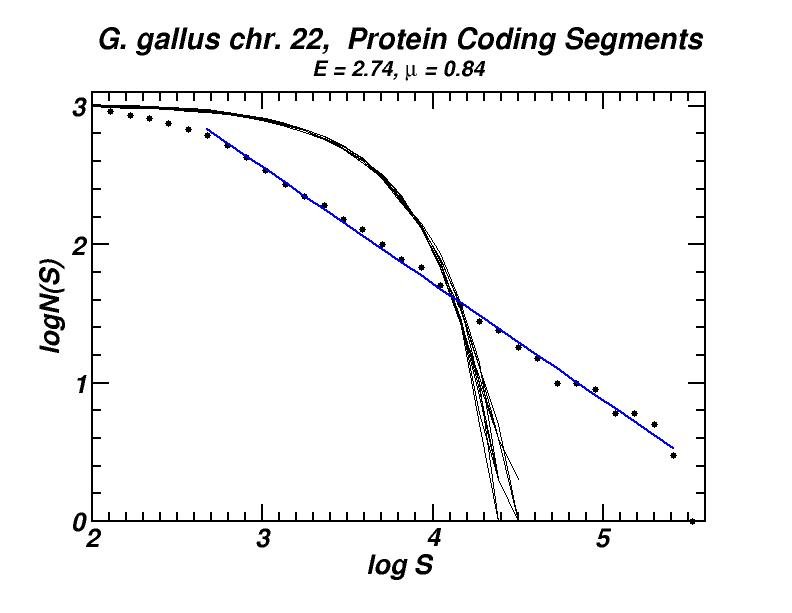
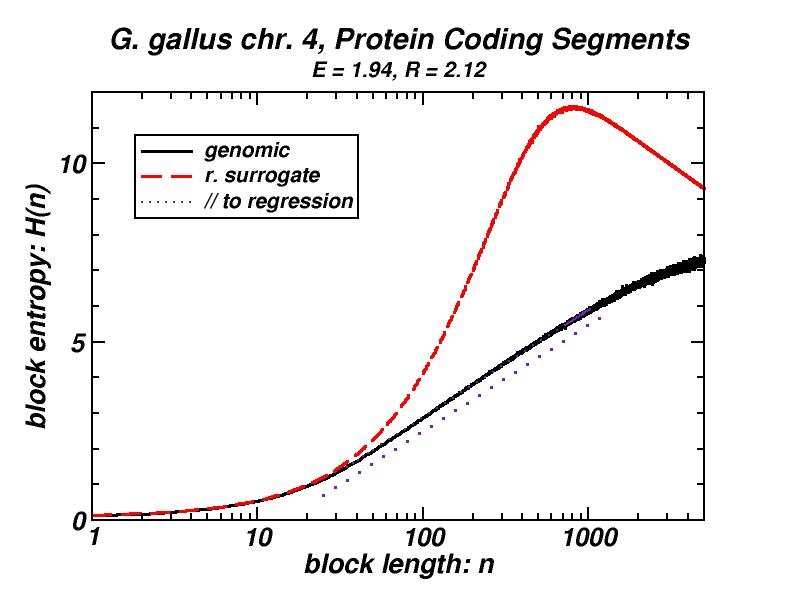
Figure 4: (a, b) Examples of power-law-like chromosomal distributions of distances between protein coding segments (PCSs) [14]. (c, d) Examples of the entropic scaling in the alternation of short (PCSs) with long non-coding spacers exhibits linearity in semi-logarithmic scale, indication of a fractal and ordered pattern [15].
The large-scale features of the spatial arrangement of protein-coding segments (PCS) are investigated by means of the size distribution of their distances. Inter-PCS distances are found to follow size distributions which may be approximated by power-laws. Linearity in log-log scale extends to several orders of magnitude in the genomes of organisms as disparate as mammals, insects and plants. This feature is also present in the most compact eukaryotic genomes and in half of the examined bacteria, despite their very limited non-coding space [14].
We tried to determine the sequence of events in the course of genomes’ evolution which may account for the formation of the observed size distributions. The proposed mechanism essentially includes two types of events: (i) Segmental duplications (and possibly paleopolyploidy), and (ii) the subsequent loss of most of the duplicated genes (see Figure 6 herein and [14]). Such events are well known to occur repetitively for long evolutionary periods. Through computer simulations, it is shown that the formulated scenario generates power-laws, which remain robust for a variety of parameter choices, and is still robust if insertion of external sequences, such as viruses or proliferating retroelements is also included. Moreover, the simulated molecular dynamics continues to sustain power-laws in the inter-PCS distances’ size distribution even under conditions of removal of most of the non-coding DNA, thus explaining the existence of this pattern in genomes as compact as that of Takifugu rubripes.
Statistical methods, including block entropy based approaches, have already been used in the study of long-range features of genomic sequences seen as symbol-series, either considering the full alphabet of the four nucleotides or a binary character set (e.g. purine & pyrimidine). We explored the alternation of short protein-coding segments with the intervening long non-coding spacers in entire chromosomes, focussing on the scaling properties of block entropy [15]. Entropic scaling was studied in several works in the framework of statistical physics. Their findings suggested that linearity in semi-logarithmic scale characterises symbol sequences which exhibit fractal properties and long-range order, while this linearity was analytically derived in the case of the logistic map at the Feigenbaum accumulation point. In the perspective of an entropic approach of the (one-dimensional) chromosomal distribution of PCSs, we started with the observation that the block entropy of Cantor-like binary symbol series scales in a similar way. Then, we performed the same analysis for the full set of human chromosomes and for chromosomes of several other eukaryotes. There also, a similar but less extended linearity in semi-logarithmic scale indicating fractality is observed, while randomly formed surrogate sequences clearly lack this type of scaling. Genomic sequences always exhibited entropy values much lower than their random surrogates. Symbol sequences produced by the aforementioned evolutionary model follow the scaling found in genomic sequences, thus corroborating the conjecture that “segmental duplication – gene elimination” dynamics may have contributed to the observed long-rangeness in the coding / non-coding alternation in genomes. Earlier, we had shown by means of a box-counting method that the PCS distribution in the gene-annotated chromosomal regions available at that time exhibit fractality [1, 2].
Chromosomal distributions of Conserved Non-coding Elements (CNEs)
(a) (b)
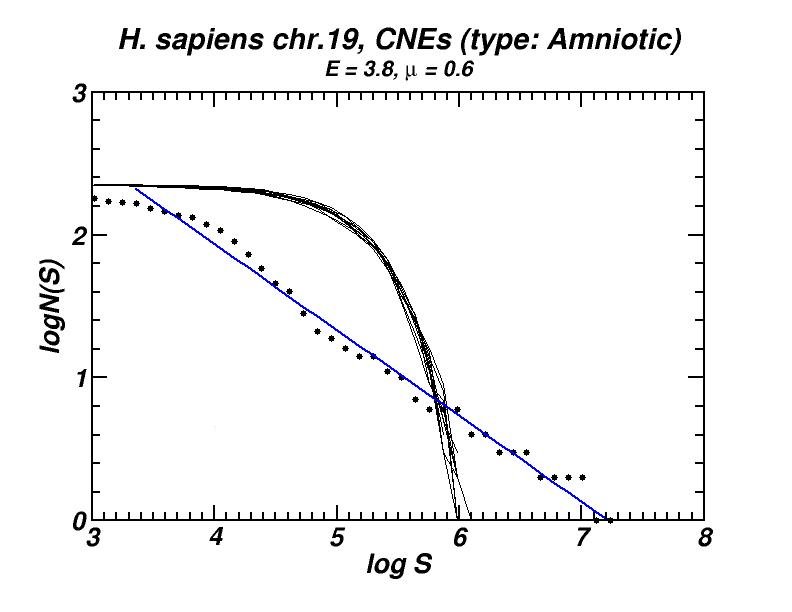
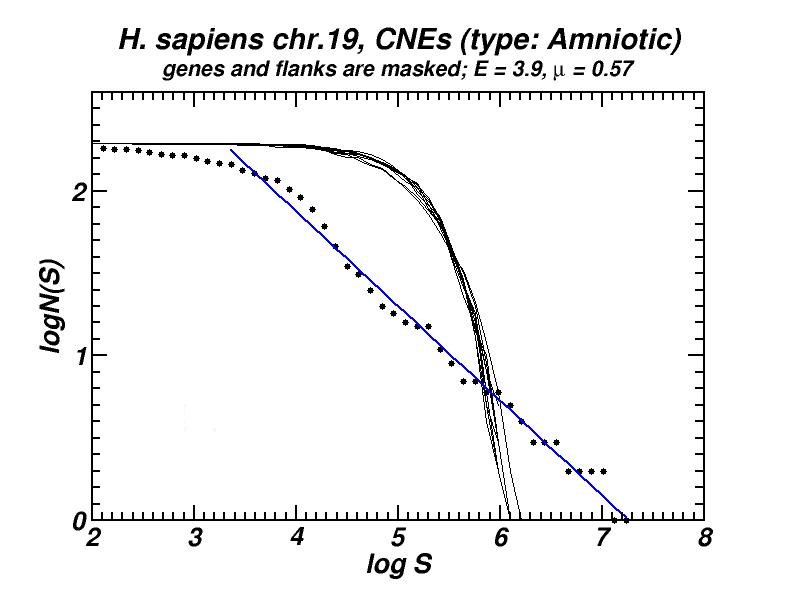
Figure 5: (a) Example of the power-law-like chromosomal distributions of distances between Conserved Not-expressed Sequences (CNEs) derived after alignment of five amniotic genomes. In (b) is shown that this type of distribution is persistent after exclusion of all CNEs located within or close to genes, thus excluding the possibility that the observed power-law is a mere consequence of the chromosomal distribution of genes. Thus, its appearance has to be attributed to the genomic dynamics and evolution of CNEs [19].
Conserved, ultra-conserved and other classes of constrained elements (collectively referred as CNEs here), identified by comparative genomics in a wide variety of genomes, are non-randomly distributed across chromosomes. These elements are defined by various degrees of conservation between organisms. We investigated the chromosomal distribution of CNEs by means of the size distribution of inter-CNE distances [19]. We found the widespread occurrence of power-law-like distributions, a feature which is associated with fractality and self-similarity. Given that CNEs are often found to be spatially associated with genes, especially with those that regulate developmental processes, we have verified, after appropriate gene masking, that a power-law-like pattern emerges irrespectively of whether elements found close or inside genes are excluded or not. Power-law-like patterns in the genomic distributions of CNEs are in accordance with current knowledge about their evolutionary history in several genomes as we shown combining the features of the obtained power-laws with the aforementioned “segmental duplication – gene elimination” model which also applies in the evolutionary history of CNEs.
(a) (b)
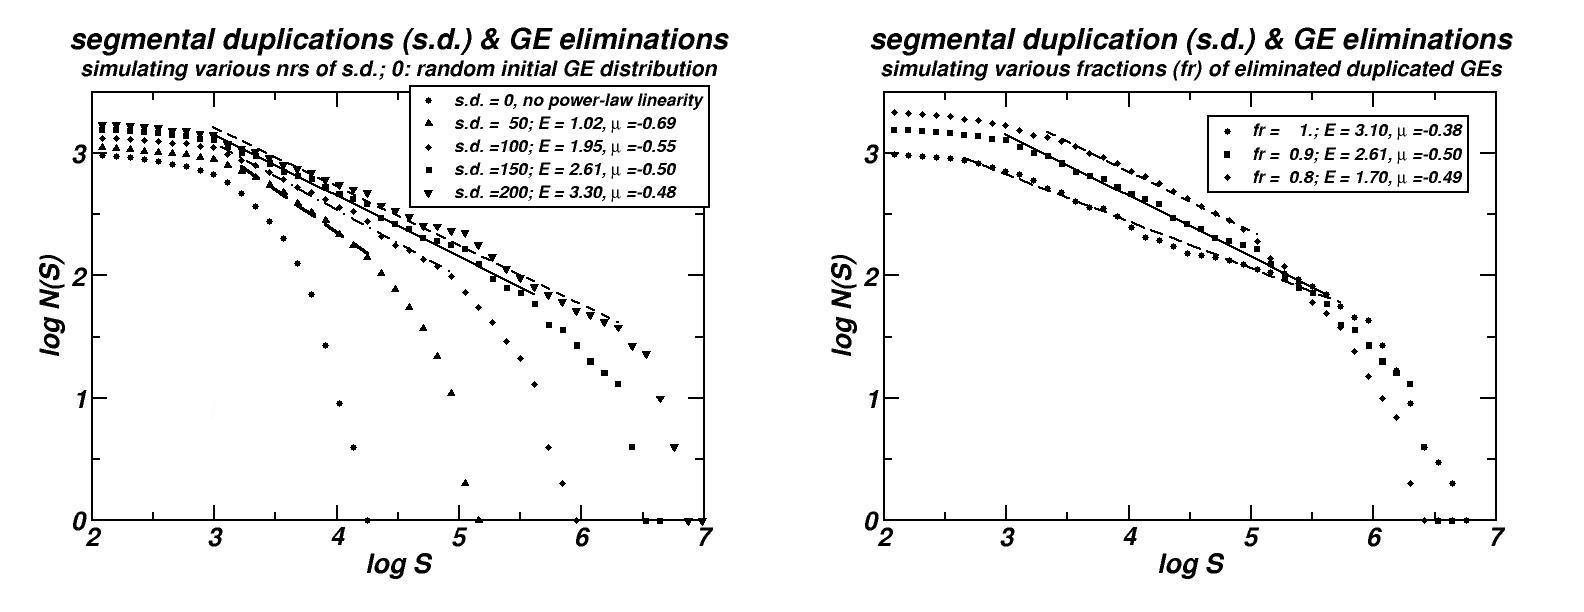
Figure 6: (a) Simulations of the “segmental duplication – gene elimination” evolutionary model proposed for the explanation of the power-laws, genomic scaling and fractality of PCSs, CNEs and CpG-Islands [14, 15, 19 & unpublished results]. A variation of this model is shown that may account for the same types of patterns found in the chromosomal distributions of not constraint genomic components as well (repeats and microsatellites, [13, 16]).